Problem set 1
Due by 11:59 PM on Friday, January 19, 2018
Submit this as a PDF on Learning Suite. Show your work when possible. You can use whatever you want to make your drawings, including Adobe Illustrator, Excel, PowerPoint, Microsoft Paint, Desmos, or scanned pen and paper.
1
The distribution of incomes in Pawnee, Eagleton, and The Good Place follows the Lorenz curves plotted below, with the following Gini coefficients:
| City | Gini |
|---|---|
| Pawnee | 0.2549 |
| Eagleton | 0.6306 |
| The Good Place | 0.1105 |
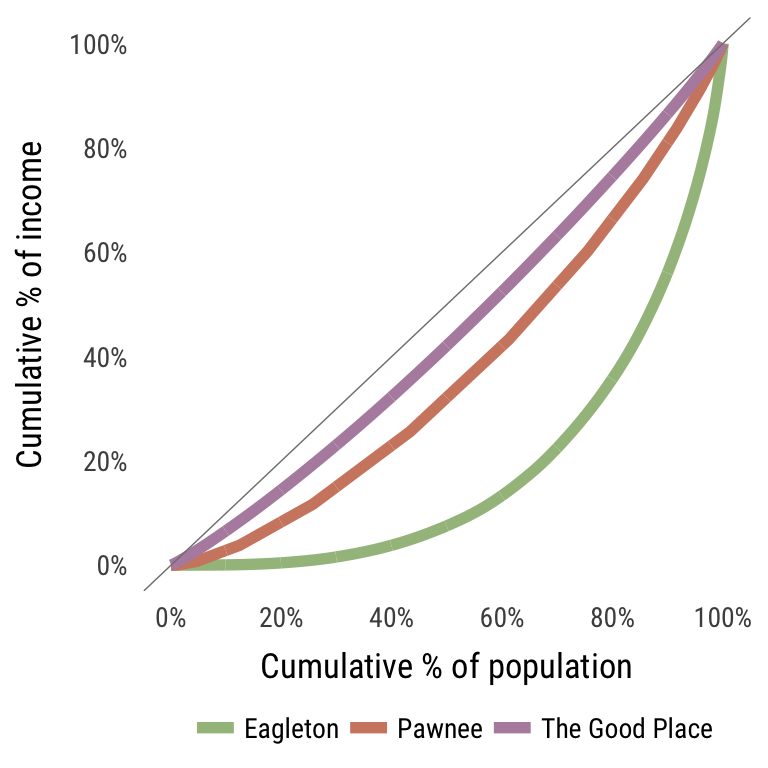
Which city has the most equally distributed income? Which has the least? How do you know? What are the possible implications of the income distributions in each of the cities?
2
The nation of Oskago is a rocky island whose inhabitants are particularly hardworking and adept fishermen. They are able to catch eight tons of fish per year, yet they can gather only four tons of coconuts per year. The going price for one coconut on the island is two fish. Nearby is the island paradise of Silveto whose lazy inhabitants catch only four tons of fish per year but gather eight tons of coconuts every year from the lush forests. On Silveto, the price of one fish is two coconuts. With the advent of lightweight boats, the possibility of virtually cost-free trade now exists.
Should the two island nations trade products? Why or why not? Graph your results.
3
The following table shows the nominal GDP (in 2015 US dollars) and the population of Japan in 2013 and 2014:Source: The World Bank
| Measure | 2013 | 2014 |
|---|---|---|
| GDP | $4,919,563,108,372.50 | $4,601,461,206,885.10 |
| Population | 127,338,621 | 127,131,800 |
Based on this information, which of the following statements regarding GDP per capita is correct? Explain why or why not:
- The GDP per capita in 2013 was $36,194.41.
- The GDP per capita fell by 6.74% between 2013 and 2014.
- The fall in the population was enough to offset the fall in the GDP for an overall growth in GDP per capita between 2013 and 2014.
- The GDP per capita fell by 6.31% between 2013 and 2014.
4
Eden, an imaginary country, produces just two output goods: apples and snakeskin handbags. In 2014 the prices of apples and handbags were $10 and $24, respectively. In 2015, the prices increased to $12 and $25. The quantities produced of the two goods were 100 and 20, respectively, in both 2014 and 2015. Which of the following statements are true? Explain why or why not:
- The nominal GDP in 2014 is $1,480.
- The real GDP is unchanged between 2014 and 2015.
- The nominal GDP growth rate between 2014 and 2015 is 14.9%.
- The economy of Eden grew between 2014 and 2015 in real terms.
5
Thailand and Cambodia produce rice and trucks at constant rates of product transformation (their possibility frontiers are straight lines—they don’t make more or less of the product depending on how much they’re currently making). In one year, Thailand could produce 1,500 tons of rice and no trucks, 500 boatloads of trucks and no rice, or any combination in between. Cambodia can produce 1,000 tons of rice or 200 boatloads of trucks, or somewhere in between. Answer the following:
- Draw the production possibility frontier for each country, labeling each curve and known points.
- Thailand can produce more of both projects than Cambodia. Can Thailand gain anything by trading with Cambodia? Explain.
- If the answer to #2 is yes, which ratios of trucks to rice create advantages from trade? Which ratios of trucks to rice create disadvantages from trade?
6
Consider the following income distribution in a 10-person village:
| Person | Income |
|---|---|
| 1 | $10,000 |
| 2 | $12,000 |
| 3 | $15,000 |
| 4 | $30,000 |
| 5 | $50,000 |
| 6 | $70,000 |
| 7 | $100,000 |
| 8 | $110,000 |
| 9 | $120,000 |
| 10 | $800,000 |
Draw the Lorenz curve for the village and calculate the Gini coefficient.
7
- The consumer price index (1982–84 = 100) in December 1980 was 86.4, and it was 247.963 in December 2017.Source:
CPIAUCSLfrom FRED
How much inflation has there been between 1980 and 2017? - In December 1980 the average price of unleaded regular gasoline was $1.34; in December 2017, it was $2.48.Source: Weekly U. S. Regular All Formulations Retail Gasoline Prices from the US EIA
Did the price of gasoline increase or decrease in real terms over this period? By what percentage has the price of gasoline increased (in real terms) over this 37-year period? What is the implied average annual rate of growth or decline in the real price over this period? - In 1980 the federal minimum wage was $3.10 per hour; today it is $7.25. Has its real value increased or decreased over this period? What policy and managerial implications does this have?