Problem set 5
Due by 11:59 PM on Friday, March 2, 2018
Submit this as a PDF on Learning Suite. Show your work when possible. You can use whatever you want to make your drawings, including Adobe Illustrator, Excel, PowerPoint, Microsoft Paint, Desmos, or scanned pen and paper.
Cite your sources and show your work.
1
A recent study found that the demand and supply schedules for frisbees are as follows:
| Price per frisbee | Quantity demanded | Quantity supplied |
|---|---|---|
| $11 | 1,000,000 | 15,000,000 |
| $10 | 2,000,000 | 12,000,000 |
| $9 | 4,000,000 | 9,000,000 |
| $8 | 6,000,000 | 6,000,000 |
| $7 | 8,000,000 | 3,000,000 |
| $6 | 10,000,000 | 1,000,000 |
- What are the equilibrium price and quantity? Draw a graph and label the equilibrium points as P* and Q*.
- Frisbee manufacturers persuade the government that frisbee production improves scientists’ understanding of aerodynamics and thus is important for national security. A concerned Congress votes to impose a price floor $2 above the equilibrium price. What is the new market price? How many frisbees are sold? Add this to your graph and mark the new Q and P.
- Angry college students march on Washington and demand a reduction in the price of frisbees. An even more concerned Congress votes to repeal the price floor and impose a new price ceiling of $1 below the former market price. What is the new market price? How many frisbees are sold? Add this to your graph and mark the new Q and P.
2
A recent Trump administration proposal called for replacing portions of the Supplemental Nutrition Assitation Program (SNAP, or food stamps) with a “Blue Apron”-style in-kind food assistanceMake sure you read this article for this question; see also NPR, “Trump Administration Wants To Decide What Food SNAP Recipients Will Get”.
called “America’s Harvest Box.”
When announcing the program, Secretary of Agriculture Sonny Perdue stated that “It maintains the same level of food value as SNAP participants currently receive, provides states flexibility in administering the program, and is responsible to the taxpayers.” In response, Kathy Fisher, policy director at Philadelphia’s Coalition Against Hunger stated “We know SNAP works now, when people can choose what they need. How they would distribute foods to people with specialized diets, or [to people in] rural areas … It’s very expensive and very complicated.”
Use indifference curve analysis to evaluate each of these statements. Under models of rational consumer behavior, where food is a normal good, does America’s Harvest Box maintain the same level of food value for SNAP recipients? What kind of income and substitution effects would such a program have? What does Kathy Fisher mean when she says that “people can choose what they need?” and how does that statement relate to income and substitution effects and government subsidies of food? What are the possible consequences of America’s Harvest Box? Discuss in ≈100 words and a graph.
3
On July 14, 2007, the Economist published this story about Zimbabwe’s economy. Complete the unfinished sentence at the end of the quotation, draw a graph of supply and demand curves to illustrate what you wrote, and add any additional sentences to explain your answer:
[In] Zimbabwe appearances are deceptive. The economy is collapsing. Eight in ten people have no formal jobs; inflation, officially estimated at more than 3,700%, may actually be twice as high. So President Robert Mugabe has decided to try to do something about the galloping prices of basic goods [such as cooking oil, soap and meat]. Ignoring protests from Gideon Gono, the governor of the central bank, Mr Mugabe, who famously despises “bookish economics,” has sent the police in to order shopkeepers to slash their prices, forcing them to sell at a loss. The predictable result is…
4
- Draw a diagram to illustrate the competitive market for bread, showing the equilibrium where 5,000 loaves are sold at a price of $2.
- Suppose that the bakeries get together to form a cartel. They agree to raise the price to $2.70 and jointly cut production to supply the number of loaves that consumers demand at that price. Shade the areas on your diagram to show the consumer surplus, producer surplus, and deadweight loss caused by the cartel.
- For what kinds of goods would you expect the supply curve to be highly elastic?
- Draw diagrams to illustrate how the share of surplus obtained by producers and consumers depends on the elasticity of the supply curve.
5
From statistical studies, we know that the supply curve for wheat in 1981 was:
\[Q_S = 1800 + 240P\]
where price is measured in dollars per bushel and quantities are in millions of bushels per year. These studies also indicate than in 1981 the demand curve for wheat was:
\[Q_D = 3550 - 266P\]
What was the market clearing price in 1981?
The demand for wheat has two components–domestic demand (demand by US consumers) and export demand (demand by foreign consumers). By the mid-1980s, the domestic demand for wheat had risen only slightly (due to modest increases in population and income), but export demand had fallen sharply. Export demand had dropped for several reasons. First and foremost, was the success of the Green Revolution in agriculture—developing countries like India that had been large importers of wheat became increasingly self-sufficient. On top of this, the increase in the value of the dollar against other currencies made US wheat more expensive abroad. Finally, European countries adopted protectionist policies that subsidized their own production and imposed tariff barriers against imported wheat. In 1985, for example, the demand curve for wheat was:
\[Q_D = 2580 - 194P\]
The supply curve was more or less the same as 1981.
What was the market clearing price in 1985?
Suppose that in 1985 the Soviet Union had bought an additional 200 million bushels of US wheat. What would be the free market price of wheat have been and what quantity would have been produced and sold by US farmers?
6
Choose any published textbook that you have been using in some other class.But not in this class, since CORE is free!
Search online for the price of that book from a number of different suppliers (Amazon, Abebooks, eBay, BYU Bookstore, etc.).
- Collect these prices in a table.
- How different are these prices? How much price dispersion is there? Why? What accounts for the differences (or similarities) in price? Discuss in ≈50 words.
7
You were just hired to be the chief economist for a large nonprofit theater and opera house.Because nonprofit theaters totally have chief economists.
Over the past year, the executive director of the theater has been interested in determining the market demand for theater tickets. Being of a quantitative mind, she ran a clever experiment. For one show every week, she assigned experimental prices to a pool of 250 tickets and measured how many people purchased those tickets at those prices. She collected the data in this CSV file. Your job is to use statistical and economic tools to analyze this data.
- Create a scatterplot of price and quantity, with quantity along the x-axis.
- Use regression analysis to derive an estimated demand curve for theater tickets.You’ll need to break out R again.
How well does the model fit the data and predict price? What could you do to get a better estimate? - Based on the results of the regression in #2, create a formula for ticket demand that follows this structure: \(P = aQ + b\), where \(a\) is the coefficient, or change in quantity, and \(b\) is the y-intercept. Round a and b to nearest hundredth (0.01).
- Assume that the equation in #3 is the actual market demand for tickets at theaters of this size and quality.Super big hint: your formula should be \(P = -0.09Q + 57.89\).
What quantity of tickets would generate the greatest amount of revenue for your theater?Remember \(TR = PQ\).
What is the revenue-maximizing price? - How many tickets would be sold if they were priced at $30 (use the assumed market demand from #3)? How elastic are tickets at $30?Hint: Recall that the formula for elasticity of demand is \(\frac{\Delta Q}{\Delta P} \times \frac{P}{Q}\). \(\frac{\Delta Q}{\Delta P}\) is the coefficient of \(P\) when the demand formula is written in terms of Q (i.e. if the demand is written as \(Q = -0.3P + 4\), \(\frac{\Delta Q}{\Delta P}\) is -0.3). You can also calculate it with Excel if you divide the change in quantity by the change in price along all the different quantities and prices.
How elastic are tickets at $50? How elastic are tickets at $15? What do all these elasticities mean? Interpret them using increments of 10%.
The fixed costs of running a musical performance at this theater are substantial—assume it costs $3,000 for regular upkeep of the theater, licensing and copyright arrangements, and other costs.lollllz no it doesn’t. It’s way more expensive than that. But this is a fake example, so.
There are also variable costs, like the number of playbills that need to be printed, the number of ads that need to be purchased, etc. Based on past history, your executive director has estimated that the theater’s total costs of running a show can be estimated with the equation \(TC = 0.07Q^2 + 3000\).
- What quantity of tickets should the theater sell if it is interested in maximizing its profit?Hint: Remember that profits are maximized when \(MC = MR\).
What price should it charge? How much profit would it make? Are the prices you get from the demand formula and the marginal revenue formula different? Why or why not? - The theater is not a monopoly and cannot set its prices willy nilly.The director was able to manipulate prices for her experiment through online sales where consumers were unaware of variations in price.
The market price for tickets to similar musicals at similar theaters is $25. Given this market price, and given the fact that the theater is a price-taker, what quantity of tickets should the theater sell to maximize its profit?Hint: Remember that in perfect competition, price is the marginal revenue—the theater will get $25 per person regardless of how many people show up (assuming the theater is infinitely big).
How much profit will the theater make? - Given that it is a price-taker, what could the theater do to raise its prices and increase its profits? Discuss in ≈100 words.
8
The market demand for pizza in Provo is given by the equation \(Q = 100 - 10P\), where Q is the number of pizzas sold per day and P is the price of a standard pizza.Hint: remember that a linear demand curve like this can also be expressed with P on the lefthand side, like \(P = 10 - 0.1Q\).
(Assume that all pizzas are about the same.) Assume initially that the market for pizzas in the town is competitive. All firms have the same total cost function for making pizzas: \(TC = 6Q\).
- Draw the demand curve (label it D) and the competitive supply curve (label it S).
- What is the equilibrium price and quantity of pizzas in competitive equilibrium? (Calculate your answers and give them here, not on the graph.)
- If there were a $1 tax on pizzas, who would end up effectively paying the tax? (What would be the incidence of the tax?) On the graph, show the welfare cost of the tax (also known as the deadweight loss). How much tax revenue is there?
- Now suppose that the production of pizzas in the town is taken over by the Brick Oven Pizza Trust, which simply purchased every pizza firm.They somehow got FTC approval.
Costs of production do not change. On a new graph show the monopolistic output (\(Q_m\)) and the monopolistic price (\(P_m\)). Calculate the monopolistic output. - What is the amount of economic profit that the Brick Oven Pizza Trust will make each day?
- On the graph, show the welfare cost of monopoly (also known as the deadweight loss). Indicate this area clearly. How much surplus is lost because of monopoly?
9
Suppose long-distance trains are run by one private company named USRail. USRail has no competition for long-distance passenger travel, but is not an agency of the government.
The demand for long-distance train travel is given by:
\[P = 2.1 - 0.5Q\] where Q is millions of passenger miles per month and P equals the price per mile charged for train travel. This demand curve means that:
\[ \begin{align} TR &= PQ \\ & = (2.1 - 0.5Q) \times Q \\ & = 2.1Q - 0.5Q^2 \\ MR &= 2.1 - Q \end{align} \]
The cost of long-distance trains are divided into the fixed costs of maintaining the rails and the variable costs of running more trips. Monthly total costs (in millions of dollars) are given by the equation:
\[TC = 1.5 + 0.1Q\]
Answer these questions (you don’t have to draw a picture, but it’ll probably be really helpful if you do):
- What is the average cost per passenger mile when \(Q = 1\)? When \(Q = 2\)?
- What is the marginal cost at \(Q = 1\) and \(Q = 2\)?
- The government is concerned about the lack of competition for USRail. It is considering new regulations to ensure marginal cost pricing, which is the competitive equilibrium. Calculate the number of passenger miles demanded if USRail is forced by law to set \(MC = P\).
- What are the total profits of USRail under this law?
- Suppose the government decided to let USRail maximize profits. How many passenger miles would be sold in that equilibrium, and what would the price be?
- What are the profits of USRail under this policy?
- The government, however, is aware that letting USRail behave like a monopoly means that there is a deadweight loss to society. Calculate the deadweight loss of the policy in #5.Hint: Remember that the demand curve represents the consumer’s willingness to pay, and that the area of a rectangle is \(\text{length} \times \text{width}\) and that the area of a triangle is \(0.5 \times \text{base} \times \text{height}\).
- Capitol Hill policy staffers, after many memos, have proposed a plan whereby the government will subsidize USRail to produce at the competitive (efficient) point. They have hired you to assess the economics of this plan. Can you come up with a subsidy that would allow USRail to operate at the efficient point? Thinking about surplus allocation, would this be preferable to allowing USRail set prices as they see fit? Why or why not?
- Another policy favored by some staffers is to break up USRail into 8 regional rail companies. Would this be sufficient to achieve the efficient level of output?
10
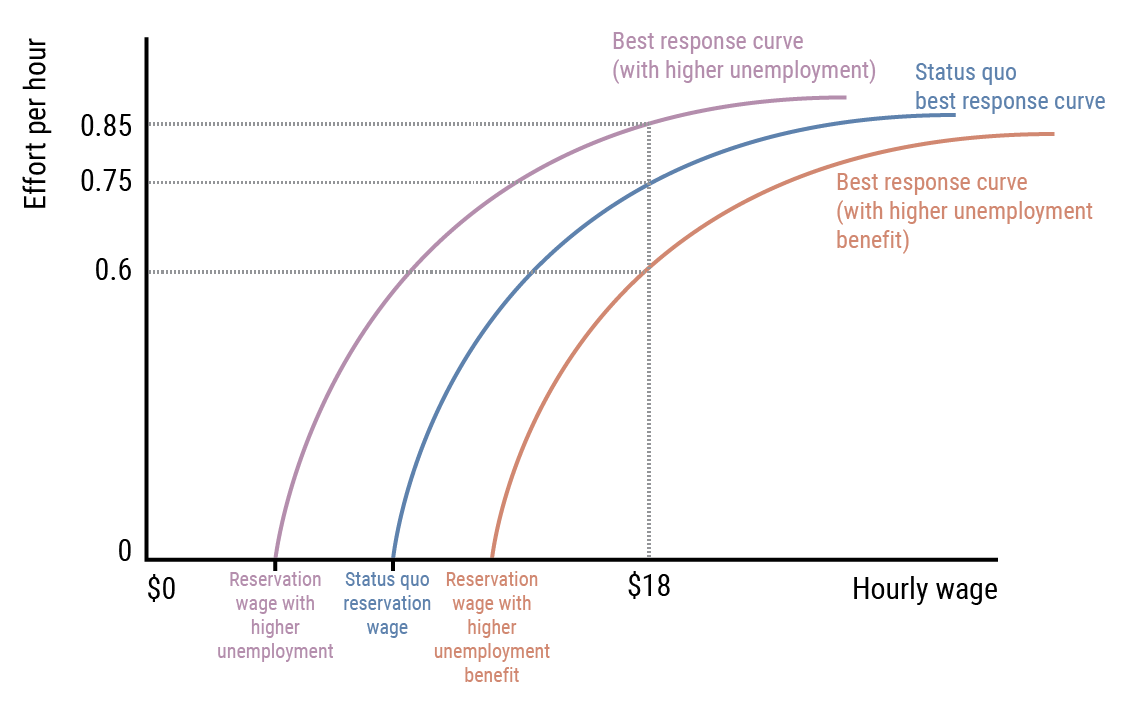
Suppose that, with the status quo best response curve in the figure below, a firm chooses the wage to minimize the cost of effort, and the worker’s best response is an effort level of 0.6. If unemployment rose:
- Would effort be higher or lower than 0.6 if the firm did not change the wage?
- How would the firm change the wage if it wanted to keep the effort level at 0.6?
- How would the wage change if the firm minimized the cost of effort at the new unemployment level?