Lab 2
Materials for class on Friday, January 12, 2018
Contents
Gini coefficients
Recall that the Gini coefficient is the area between the line of equality and the Lorenz curve, or \(\frac{A}{A + B}\). Also, recall the shortcut using the covariance and mean of the income distribution, where \(x\) = income, \(y\) = cumulative proportion of the population, and \(\mu_x\) = mean of income:
\[ \frac{2}{\mu_x} \text{Cov}(x, y) \]
Calculating Gini coefficients in Excel
Cacluating Gini coefficients with R
# Load packages
# install.packages("ineq")  # Run this if the ineq package isn't installed yet
library(ineq)

# Setting a seed ensures that all random draws are the same every time this
# script is run
set.seed(1234)

# Create a normally distributed list of 1,000 incomes with a mean of $50,000 and
# a standard deviation of $10,000
fake_income1 <- rnorm(1000, 50000, 10000)

# How is it distributed?
hist(fake_income1)
## [1] 0.1123363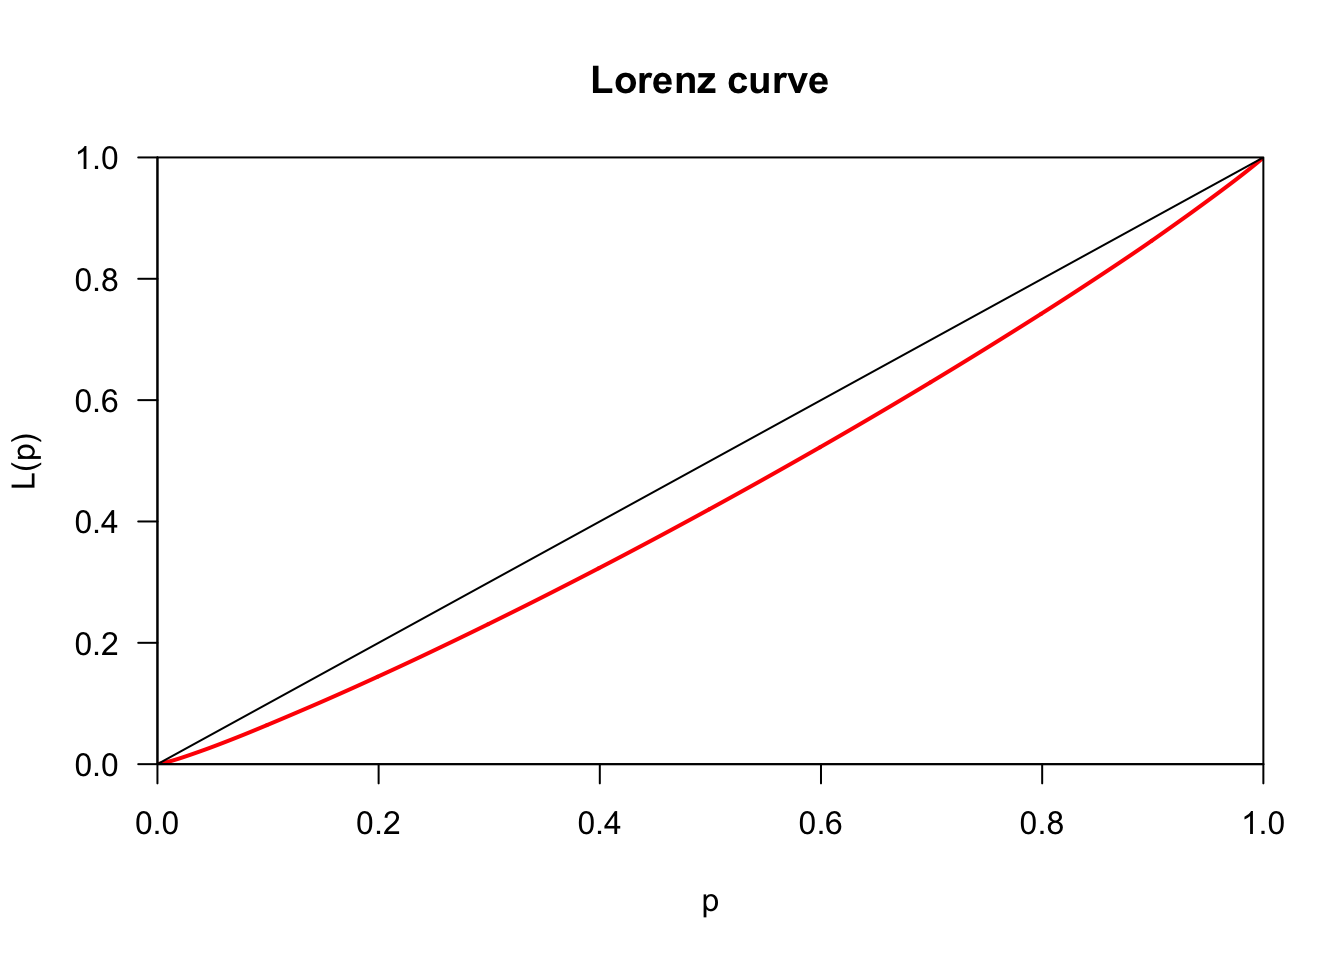
# Create a skewed in distribution by combining a bunch of others with different
# means and standard deviations
fake_income2 <- rnorm(500, 85000, 20000)
fake_income3 <- rnorm(300, 115000, 25000)
fake_income4 <- rnorm(150, 200000, 30000)
agg_inc <- c(fake_income1, fake_income2, fake_income3, fake_income4)

# How is it distributed?
hist(agg_inc, breaks = 20)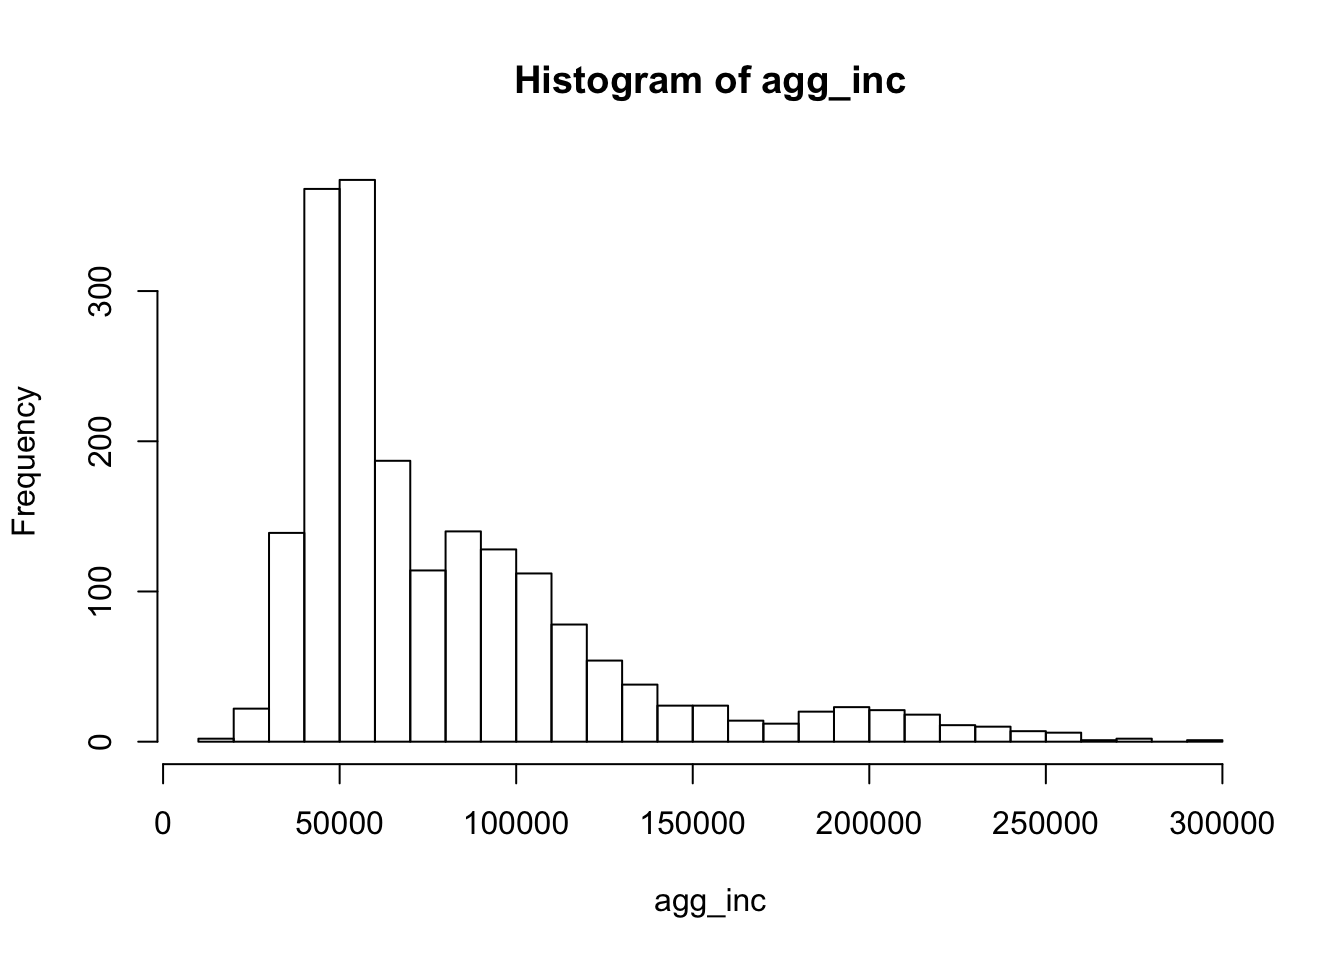
## [1] 0.2888986
# US 2008 income data from the psych package (install if you haven't already)
library(psych)
data("income")  # This loads the income data from the psych package

# Create vector of incomes
# The census income data has counts of people in each income bracket. The
# rep.int() function expands those those brakets with actual numbers (e.g. if
# there are 4 people in the 2500 bracket, it'll make a list of 2500, 2500, 2500,
# 2500)
US_income2008 <- rep.int(income$value,income$count)

# Gini coefficient
ineq(US_income2008, type = "Gini")
## [1] 0.424258# Graph with Lorenz curve
plot(Lc(US_income2008), main = "US income distribution, 2008", col = "red")
Perecnt change
To calculate the percent change (i.e inflation rate, growth rate), use the following formula:
\[ \frac{\text{Current} - \text{Previous}}{\text{Previous}} \] Pay attention to the time periods in data from FRED.Or anywhere, really.
Datasets like GDP are reported quarterly, while the CPI is monthly. If you need to calculate the annual change (or annual inflation), make sure you either (1) use the same month or quarter as your current and previous times (i.e. January 2016 and January 2017), or (2) add all the percent changes within the year (i.e. add the rates from January 2016, April 2016, July 2017, and October 2017).